Chart Widget
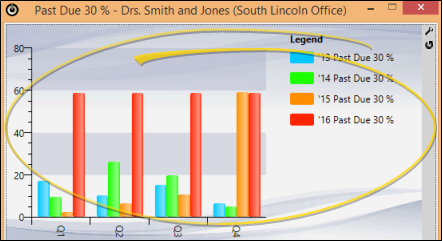
Use the Chart widget to get an overall picture of patient activity, such as the percentage of patients that are past due or the percentage of missed appointments, in a variety of formats. You can also use the Chart widget to compare data among your orthodontists and/or offices. Your selected chart data, office, and orthodontist selections are listed in the Chart widget header for easy recognition of the data you are viewing.
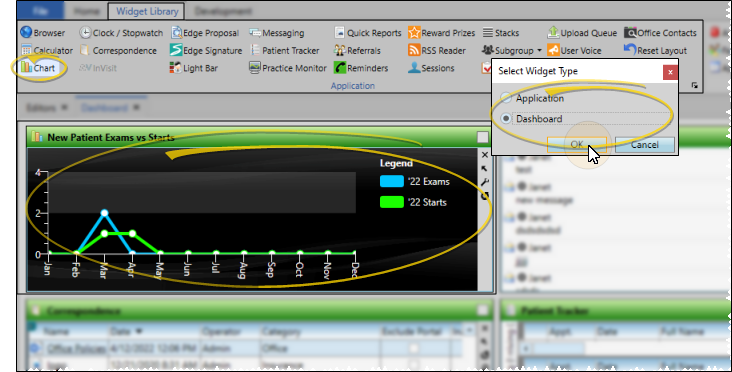
From the Application section of the Widget Library ribbon bar, choose the Chart widget, and select whether to open it as a Dashboard or Application widget.
Click the  Settings icon on the widget tool panel, then choose the data, the type of chart, and the filters to use for the widget display. Read the descriptions, and choose your Chart widget settings carefully: Several settings work together to calculate your chart results.
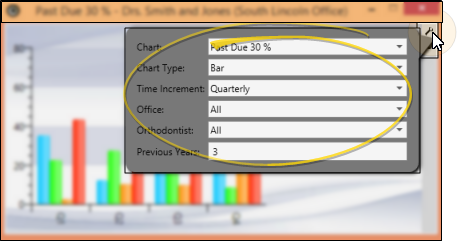
Choose the type of data to include in the chart.
Appointment Data Considerations - Data regarding appointments looks at the "Type" assigned to the appointment, not the description or code. (See "Appointment Type / Procedure Editor" for details about assigning "types").
Average Checkout Time (in minutes)![]() - The average number of minutes patients were in "Check Out" before they were "Exited" from your system. This calculation is only correct if patients sign into your system and progress through your
- The average number of minutes patients were in "Check Out" before they were "Exited" from your system. This calculation is only correct if patients sign into your system and progress through your
Average Doctor Wait Time (in minutes)![]() - The average number of minutes patients were flagged "Doctor Needed" while seated. This calculation is correct only if you consistently update the doctor's activity in your Light Bar. (See "Light Bar Widget" for details.)
- The average number of minutes patients were flagged "Doctor Needed" while seated. This calculation is correct only if you consistently update the doctor's activity in your Light Bar. (See "Light Bar Widget" for details.)
Average Net Arrival Time (in minutes) ![]() - The average number of minutes that patients arrived early (signed in early) for their appointments, This calculation is only correct if patients sign into your system and progress through your
- The average number of minutes that patients arrived early (signed in early) for their appointments, This calculation is only correct if patients sign into your system and progress through your
Average Net Doctor Time (in minutes)![]() - The average number of minutes patients were flagged "Doctor Here" minus the scheduled doctor time defined for each
- The average number of minutes patients were flagged "Doctor Here" minus the scheduled doctor time defined for each
Average Net Procedure Time (in minutes)![]() - The average number of minutes a patient was flagged as "Seated", minus the number of minutes scheduled for the procedure. This calculation is only correct if patients sign into your system and progress through your
- The average number of minutes a patient was flagged as "Seated", minus the number of minutes scheduled for the procedure. This calculation is only correct if patients sign into your system and progress through your
Average Patient Wait (in minutes)![]() - The average number of minutes patients waited to be seated after they signed into your
- The average number of minutes patients waited to be seated after they signed into your
Average Scheduled Wait (in minutes)![]() - The average number of minutes past the scheduled appointment time that patients were "Seated", regardless of the time they signed into your
- The average number of minutes past the scheduled appointment time that patients were "Seated", regardless of the time they signed into your
Charges Per Start![]() - The ratio of the total charges posted to the number of patients with a kept appointment where the Type is ''Start''.
- The ratio of the total charges posted to the number of patients with a kept appointment where the Type is ''Start''.
Charges Per Start Made![]() - The ratio of the total charges posted to the number of patients with a scheduled appointment where the Type is ''Start''.
- The ratio of the total charges posted to the number of patients with a scheduled appointment where the Type is ''Start''.
Charges vs. Receipts ![]() - This chart shows the total charges posted vs. the total receipts posted for the specified time increment.
- This chart shows the total charges posted vs. the total receipts posted for the specified time increment.
Contract Start Value by Treatment Coordinator![]() - The sum of all orthodontic contract treatment fees where the patient has a treatment start date within the selected time frame, grouped by treatment coordinator.
- The sum of all orthodontic contract treatment fees where the patient has a treatment start date within the selected time frame, grouped by treatment coordinator.
Contract Starts by Treatment Coordinator![]() - The number of contract starts where the patient has a treatment start date within the selected time frame, grouped by treatment coordinator.
- The number of contract starts where the patient has a treatment start date within the selected time frame, grouped by treatment coordinator.
Future Made Patient Exams ![]() - The number of scheduled appointments for today or in the future where the Type is "Exam". (This differs from the New Patient Exams Made calculation, which includes scheduled appointment dates in the past as well as the future.
- The number of scheduled appointments for today or in the future where the Type is "Exam". (This differs from the New Patient Exams Made calculation, which includes scheduled appointment dates in the past as well as the future.
Missed Appointment % ![]() - The percentage of the total number appointments processed as Kept and Missed that are Missed.
- The percentage of the total number appointments processed as Kept and Missed that are Missed.
New Patient Exams ![]() - The number of kept appointments where the Type is ''Exam''.
- The number of kept appointments where the Type is ''Exam''.
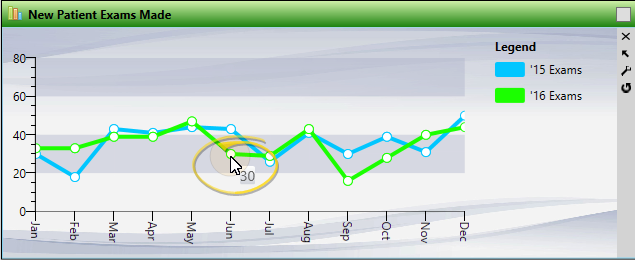
New Patient Exams Made![]() - The number of scheduled appointments in the past, today, or the future, where the Type is ''Exam''. (This differs from the Future Made Patient Exams calculation, which only includes appointment dates in the future.)
- The number of scheduled appointments in the past, today, or the future, where the Type is ''Exam''. (This differs from the Future Made Patient Exams calculation, which only includes appointment dates in the future.)
New Patient Exams Made vs Starts Made ![]() - The number of scheduled appointments where the Type is "Exam" vs, the number of scheduled appointments where the Type is "Start".
- The number of scheduled appointments where the Type is "Exam" vs, the number of scheduled appointments where the Type is "Start".
New Patient Exams vs Starts ![]() - This chart shows the number of kept appointments where the Type is "Exam" vs, the number of kept appointments where the Type is "Start".
- This chart shows the number of kept appointments where the Type is "Exam" vs, the number of kept appointments where the Type is "Start".
New Patient Starts![]() - The number of kept appointments where the Type is ''Start''.
- The number of kept appointments where the Type is ''Start''.
New Patient Starts Made![]() - The number of scheduled appointments where the Type is ''Start'.
- The number of scheduled appointments where the Type is ''Start'.
New Patient Starts Made vs Debonds Made ![]() - The number of scheduled appointments where the Type is "Start" vs, the number of scheduled appointments where the Type is "Debond".
- The number of scheduled appointments where the Type is "Start" vs, the number of scheduled appointments where the Type is "Debond".
New Patient Starts vs Debonds ![]() - This chart shows the number of kept appointments where the Type is "Start" vs, the number of kept appointments where the procedure type is "Debond".
- This chart shows the number of kept appointments where the Type is "Start" vs, the number of kept appointments where the procedure type is "Debond".
Past Completion %![]() - The percentage of the total number of patients that completed treatment during the specified time frame that were past their expected treatment time. (Treatment times are calculated from the Expected Appliance Removal date and Actual Appliance Removal date. You can find these dates on the Findings page of the patient folder.)
- The percentage of the total number of patients that completed treatment during the specified time frame that were past their expected treatment time. (Treatment times are calculated from the Expected Appliance Removal date and Actual Appliance Removal date. You can find these dates on the Findings page of the patient folder.)
Past Due 30 Days % ![]() - The percentage of the total amount due that is at least 30 days past due. This statistic always shows the up-to-date amount, regardless of the time frame specified.
- The percentage of the total amount due that is at least 30 days past due. This statistic always shows the up-to-date amount, regardless of the time frame specified.
Practice Connect Users![]() - The number of unique devices that have downloaded your Practice Connect app, including registered responsible parties, registered patients, and other users.
- The number of unique devices that have downloaded your Practice Connect app, including registered responsible parties, registered patients, and other users.
Receipts Per Appointment![]() - The ratio of total receipts collected to the number of patients with a kept or missed appointment during the specified time frame.
- The ratio of total receipts collected to the number of patients with a kept or missed appointment during the specified time frame.
Receipts Per Doctor Hour vs. Staff Hour ![]() - This chart shows the ratio of total receipts to the number of doctor hours, verses the ratio of total receipts to the number of staff hours worked during the specified time frame. (See "Scheduler Templates Editor" for details about defining the number of doctor, staff, and total hours worked per day.)
- This chart shows the ratio of total receipts to the number of doctor hours, verses the ratio of total receipts to the number of staff hours worked during the specified time frame. (See "Scheduler Templates Editor" for details about defining the number of doctor, staff, and total hours worked per day.)
Referrals![]() - The number of patients whose primary referral date is within the specified time frame, regardless of whether the referral source is a Professional, a Patient, or Other referral. You can find both the primary referral source and the associated referral date in the Patient Information Panel of the patient folder.
- The number of patients whose primary referral date is within the specified time frame, regardless of whether the referral source is a Professional, a Patient, or Other referral. You can find both the primary referral source and the associated referral date in the Patient Information Panel of the patient folder.
Referrals by Type ![]() - A comparison of the number of Professional, Patient, and Other primary referrals that occurred within the specified time frame. You can find both the primary referral source and the associated referral date in the Patient Information Panel of the patient folder.
- A comparison of the number of Professional, Patient, and Other primary referrals that occurred within the specified time frame. You can find both the primary referral source and the associated referral date in the Patient Information Panel of the patient folder.
Start Conversion %![]() - The percentage of the total number of kept appointments with the Types of "Exam" and "Start" that were "Start".
- The percentage of the total number of kept appointments with the Types of "Exam" and "Start" that were "Start".
Start Conversion Made %![]() - The percentage of the total number of scheduled appointments with the procedure types of "Exam" and "Start" that are "Start".
- The percentage of the total number of scheduled appointments with the procedure types of "Exam" and "Start" that are "Start".
Total AR vs. Past Due 30 ![]() - The total of all outstanding patient balances vs. the amount that is past due 30 days or more. These statistics always show the up-do-date amounts, regardless of the time frame specified.
- The total of all outstanding patient balances vs. the amount that is past due 30 days or more. These statistics always show the up-do-date amounts, regardless of the time frame specified.
You can choose to view the results as a line, area, or bar chart. In many cases, charts displaying direct numbers in real-time work well as bar charts or line charts. Bar and line charts are also useful for comparing multiple years, and area charts work well for current data percentages or ratios.
You can choose from daily, monthly, quarterly or yearly. Data will be calculated according to your time increment. Therefore, changing the time increment can change the chart display significantly.
You can select to include data from a single location and/or doctor on your chart, or include data from all offices and/or doctors in your practice. In addition, you can select the Comparison option to compare the data from all offices and/or orthodontists.
Enter the number of years for which you want to include data, providing a comparison for your current practice growth and production. Enter "0" to display the calculations for the current year only.
This setting is ignored by the Future Made Exams chart.
When you are happy with your widget settings, click anywhere on your screen, or press Enter on your keyboard to exit the window. The settings are saved and applied to the widget immediately. All your settings are saved even if you exit and reopen the widget.
If you have been viewing the Chart widget for some time, be sure to use the refresh icon on the widget side panel to be sure you are viewing the most recent data.
Hover over a point in an area or line chart, or over a bar in a bar chart, to display the actual number assigned to that point.
Depending on your device and panel format, you can expand and minimize widget panels, move the widget location on your screen, float them in their own windows, refresh and print data, and close the widget when you no longer need it. See Application widgets or Your Dashboard for details about using these features.