Practice Monitor Widget
Use your Practice Monitor widget to keep real-time statistics, and your progress toward practice goals available at all times.
![]() Open the Practice Monitor Widget
Open the Practice Monitor Widget
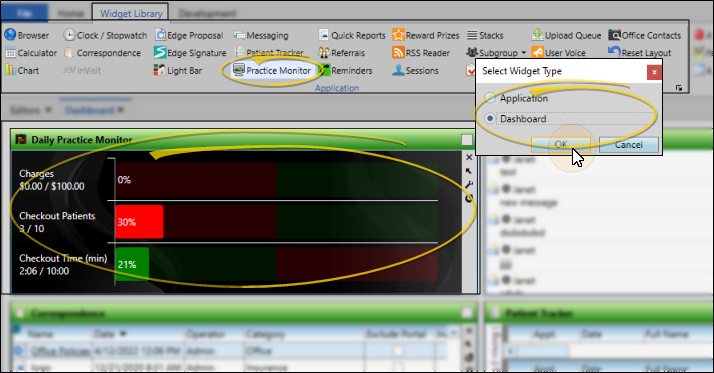
From the Application section of the Widget Library ribbon bar, choose the Practice Monitor widget, and select whether to open it as a Dashboard or Application widget.
Click the  Settings icon on the widget tool panel to select the data to view, and to set up your goals. Read the descriptions, and choose your Practice Monitor settings carefully: Several settings work together to calculate your current progress toward practice goals.
![]() Share Practice Monitor Statistics Settings
Share Practice Monitor Statistics Settings
After setting up your Practice Monitor data and goals, you can share those statistic settings with other Edge Cloud users.
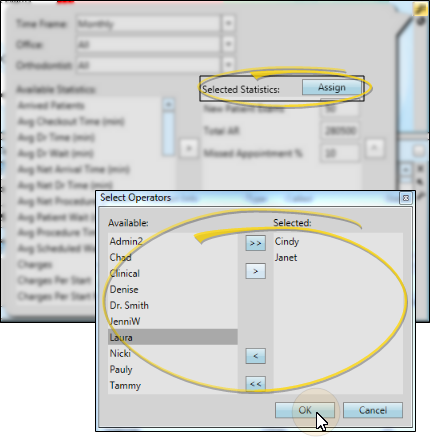
While viewing the Practice Monitor settings window, click the Assign button, then select the Edge Cloud users to share with. When those users open their Practice Monitor widget, their statistic settings will update to match yours. This does not change their time frame, office, or orthodontist settings.
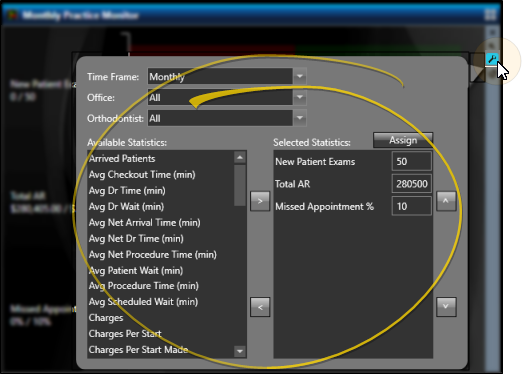
You can choose from daily, monthly, quarterly, yearly, or all time. Be sure the goal you enter for each statistic reflects your practice goal for that time frame. Only data with dates that falls within the specified time frame is used in the calculations for your Practice Monitor. Therefore, changing the time frame can change the results significantly.
You can select an individual office and/or orthodontist to monitor, or combine the progress from all offices/orthodontists in your practice. Be sure the goal you enter for each statistic reflects your practice goal for that office/orthodontist. Or, if you have selected to include all offices/orthodontists, be sure you enter goals for all data combined.
Choose a data type in the left-hand "Available Statistics" column of the settings window, and click > to add it to your Practice Monitor. In addition to reading the descriptions below, you can hover over a statistic name in the Practice Monitor settings window to see a short description. To remove a data type from the "Selected Statistics" column, select the statistic and click <. Use the ^ and v keys to set the order the data will appear in your practice monitor. Be sure to enter your practice goal beside each statistic you have included.
Appointment Data Considerations - Data regarding appointments looks at the "Type" assigned to the appointment, not the description or code. (See "Appointment Type / Procedure Editor" for details about assigning "types").
Time Frame Considerations - Only data with dates that fall within the time frame settings is considered: If you change the time frame, the results could change significantly.
Arrived Patients![]() - The number of patients that signed into your office during the specified time frame. This calculation is only correct if patients sign into your system and progress through your
- The number of patients that signed into your office during the specified time frame. This calculation is only correct if patients sign into your system and progress through your
Average Checkout Time (in minutes)![]() - The average number of minutes patients were in "Check Out" before they were "Exited" from your system. This calculation is only correct if patients sign into your system and progress through your
- The average number of minutes patients were in "Check Out" before they were "Exited" from your system. This calculation is only correct if patients sign into your system and progress through your
Average Doctor Time (in minutes)![]() - The average number of minutes patients were flagged "Doctor Here" during the specified time frame. This calculation is correct only if you consistently update the doctor's activity in your Light Bar. (See "Light Bar Widget" for details.)
- The average number of minutes patients were flagged "Doctor Here" during the specified time frame. This calculation is correct only if you consistently update the doctor's activity in your Light Bar. (See "Light Bar Widget" for details.)
Average Doctor Wait Time (in minutes)![]() - The average number of minutes patients were flagged "Doctor Needed" while seated. This calculation is correct only if you consistently update the doctor's activity in your Light Bar. (See "Light Bar Widget" for details.)
- The average number of minutes patients were flagged "Doctor Needed" while seated. This calculation is correct only if you consistently update the doctor's activity in your Light Bar. (See "Light Bar Widget" for details.)
Average Net Arrival Time (in minutes) ![]() - The average number of minutes that patients arrived early (signed in early) for their appointments, This calculation is only correct if patients sign into your system and progress through your
- The average number of minutes that patients arrived early (signed in early) for their appointments, This calculation is only correct if patients sign into your system and progress through your
Average Net Doctor Time (in minutes)![]() - The average number of minutes patients were flagged "Doctor Here" minus the scheduled doctor time defined for each
- The average number of minutes patients were flagged "Doctor Here" minus the scheduled doctor time defined for each
Average Net Procedure Time (in minutes)![]() - The average number of minutes a patient was flagged as "Seated", minus the number of minutes scheduled for the procedure. This calculation is only correct if patients sign into your system and progress through your
- The average number of minutes a patient was flagged as "Seated", minus the number of minutes scheduled for the procedure. This calculation is only correct if patients sign into your system and progress through your
Average Patient Wait (in minutes)![]() - The average number of minutes patients waited to be seated after they signed into your
- The average number of minutes patients waited to be seated after they signed into your
Average Procedure Time (in minutes)![]() - The average number of minutes that a patient was flagged as "Seated". This calculation is only correct if patients sign into your system and progress through your
- The average number of minutes that a patient was flagged as "Seated". This calculation is only correct if patients sign into your system and progress through your
Average Scheduled Wait (in minutes)![]() - The average number of minutes past the scheduled appointment time that patients were "Seated", regardless of the time they signed into your
- The average number of minutes past the scheduled appointment time that patients were "Seated", regardless of the time they signed into your
Charges![]() - The total charges for the specified period of time.
- The total charges for the specified period of time.
Charges Per Start![]() - The ratio of the total charges posted to the number of patients with a kept appointment where the Type is ''Start''.
- The ratio of the total charges posted to the number of patients with a kept appointment where the Type is ''Start''.
Charges Per Start Made![]() - The ratio of the total charges posted to the number of patients with a scheduled appointment where the Type is ''Start''.
- The ratio of the total charges posted to the number of patients with a scheduled appointment where the Type is ''Start''.
Check Out Patients![]() - The number of patients that were placed in "Check Out" during the specified time frame. This calculation is only correct if patients sign into your system and progress through your
- The number of patients that were placed in "Check Out" during the specified time frame. This calculation is only correct if patients sign into your system and progress through your
Checkout Time (in minutes)![]() - The total number of minutes patients were in "Check Out" before they were "Exited" from your system. This calculation is only correct if patients sign into your system and progress through your
- The total number of minutes patients were in "Check Out" before they were "Exited" from your system. This calculation is only correct if patients sign into your system and progress through your
Contract Start Value![]() - The sum of all orthodontic contract treatment fees where the patient has a treatment start date within the selected time frame.
- The sum of all orthodontic contract treatment fees where the patient has a treatment start date within the selected time frame.
Contract Starts![]() - The number of contract starts where the patient has a treatment start date within the selected time frame.
- The number of contract starts where the patient has a treatment start date within the selected time frame.
Debonds![]() - The number of kept appointments where the Type is ''Debond'.'
- The number of kept appointments where the Type is ''Debond'.'
Debonds Made![]() - The number of scheduled appointments where the Type is ''Debond".
- The number of scheduled appointments where the Type is ''Debond".
Doctor Hours![]() - The number of doctor hours defined in the grid templates assigned to the specified time frame. ( See "Scheduler Templates Editor" for details about defining the number of doctor, staff, and total hours worked per day.)
- The number of doctor hours defined in the grid templates assigned to the specified time frame. ( See "Scheduler Templates Editor" for details about defining the number of doctor, staff, and total hours worked per day.)
Doctor Time (in minutes)![]() - The total number of minutes that patients were flagged "Doctor Here". This calculation is correct only if you consistently update the doctor's activity in your Light Bar. (See "Light Bar Widget" for details.)
- The total number of minutes that patients were flagged "Doctor Here". This calculation is correct only if you consistently update the doctor's activity in your Light Bar. (See "Light Bar Widget" for details.)
Doctor Wait Time (in minutes)![]() - The total number of minutes that patients were flagged "Doctor Needed" while seated. This calculation is correct only if you consistently update the doctor's activity in your Light Bar. (See "Light Bar Widget" for details.)
- The total number of minutes that patients were flagged "Doctor Needed" while seated. This calculation is correct only if you consistently update the doctor's activity in your Light Bar. (See "Light Bar Widget" for details.)
Exited Patients![]() - The number of patients that were "Exited" from your system during the specified time frame. This calculation is only correct if patients sign into your system and progress through your
- The number of patients that were "Exited" from your system during the specified time frame. This calculation is only correct if patients sign into your system and progress through your
Future Made Patient Exams ![]() - The number of scheduled appointments for today or in the future where the Type is "Exam". (This differs from the New Patient Exams Made calculation, which includes scheduled appointment dates in the past as well as the future.
- The number of scheduled appointments for today or in the future where the Type is "Exam". (This differs from the New Patient Exams Made calculation, which includes scheduled appointment dates in the past as well as the future.
Missed Appointment % ![]() - The percentage of the total number appointments processed as Kept and Missed that are Missed.
- The percentage of the total number appointments processed as Kept and Missed that are Missed.
Missed Appointments![]() - The number of appointments that were processed as Missed within the specified time frame.
- The number of appointments that were processed as Missed within the specified time frame.
Net Arrival Time (in minutes)![]() - The total number of minutes that patients arrived early (signed in early) for their appointments. This calculation is only correct if patients sign into your system and progress through your
- The total number of minutes that patients arrived early (signed in early) for their appointments. This calculation is only correct if patients sign into your system and progress through your
Net Doctor Time (in minutes)![]() - The total number of minutes that patients were flagged "Doctor Here" minus the scheduled doctor time defined within each procedure. (You use the
- The total number of minutes that patients were flagged "Doctor Here" minus the scheduled doctor time defined within each procedure. (You use the
Net Procedure Time (in minutes)![]() - The total number of minutes that patients were flagged as "Seated", minus the total number of minutes scheduled for those patients. This calculation is only correct if patients sign into your system and progress through your
- The total number of minutes that patients were flagged as "Seated", minus the total number of minutes scheduled for those patients. This calculation is only correct if patients sign into your system and progress through your
New Patient Exams ![]() - The number of kept appointments where the Type is ''Exam''.
- The number of kept appointments where the Type is ''Exam''.
New Patient Exams Made![]() - The number of scheduled appointments in the past, today, or the future, where the Type is ''Exam''. (This differs from the Future Made Patient Exams calculation, which only includes appointment dates in the future.)
- The number of scheduled appointments in the past, today, or the future, where the Type is ''Exam''. (This differs from the Future Made Patient Exams calculation, which only includes appointment dates in the future.)
New Patient Starts![]() - The number of kept appointments where the Type is ''Start''.
- The number of kept appointments where the Type is ''Start''.
New Patient Starts Made![]() - The number of scheduled appointments where the Type is ''Start'.
- The number of scheduled appointments where the Type is ''Start'.
Other Referrals![]() - The number of patients whose primary referral source is on your "Other" referral list, and who were referred within the specified time frame. You can find both the primary referral source and the associated referral date in the Patient Information Panel of the patient folder. (See "Other Referrer Editor" for details about maintaining your "Other" referral list).
- The number of patients whose primary referral source is on your "Other" referral list, and who were referred within the specified time frame. You can find both the primary referral source and the associated referral date in the Patient Information Panel of the patient folder. (See "Other Referrer Editor" for details about maintaining your "Other" referral list).
Past Completion %![]() - The percentage of the total number of patients that completed treatment during the specified time frame that were past their expected treatment time. (Treatment times are calculated from the Expected Appliance Removal date and Actual Appliance Removal date. You can find these dates on the Findings page of the patient folder.)
- The percentage of the total number of patients that completed treatment during the specified time frame that were past their expected treatment time. (Treatment times are calculated from the Expected Appliance Removal date and Actual Appliance Removal date. You can find these dates on the Findings page of the patient folder.)
Past Completions![]() - The number of patients who had gone past their estimated treatment time, who completed treatment during the time frame specified. Note that patients who complete treatment early or on time are not included. (Treatment times are calculated from the Expected Appliance Removal date and Actual Appliance Removal date. You can find these dates on the Findings page of the patient folder.)
- The number of patients who had gone past their estimated treatment time, who completed treatment during the time frame specified. Note that patients who complete treatment early or on time are not included. (Treatment times are calculated from the Expected Appliance Removal date and Actual Appliance Removal date. You can find these dates on the Findings page of the patient folder.)
Past Due 30 days![]() - The amount owed that is at least 30 days past due: You can choose to show this amount for a specific doctor or office, or for your practice. This statistic always shows the full amount, regardless of the time frame specified for the Practice Monitor.
- The amount owed that is at least 30 days past due: You can choose to show this amount for a specific doctor or office, or for your practice. This statistic always shows the full amount, regardless of the time frame specified for the Practice Monitor.
Past Due 30 Days % ![]() - The percentage of the total amount due that is at least 30 days past due. This statistic always shows the up-to-date amount, regardless of the time frame specified.
- The percentage of the total amount due that is at least 30 days past due. This statistic always shows the up-to-date amount, regardless of the time frame specified.
Patient Referrals![]() - The number of patients whose primary referral source is another patient, and who were referred within the specified time frame. You can find both the primary referral source and the associated referral date in the Patient Information Panel of the patient folder..
- The number of patients whose primary referral source is another patient, and who were referred within the specified time frame. You can find both the primary referral source and the associated referral date in the Patient Information Panel of the patient folder..
Patient Wait Time (in minutes)![]() - The total number of minutes past scheduled appointment times that patients were "Seated", regardless of when the patient was signed into your
- The total number of minutes past scheduled appointment times that patients were "Seated", regardless of when the patient was signed into your
Practice Connect Patients![]() - The number of users registered as "patients" with your Practice Connect app.
- The number of users registered as "patients" with your Practice Connect app.
Practice Connect Res. Parties![]() - The number of users registered as "responsible parties" with your Practice Connect app.
- The number of users registered as "responsible parties" with your Practice Connect app.
Practice Connect Users![]() - The number of unique devices that have downloaded your Practice Connect app, including registered responsible parties, registered patients, and other users.
- The number of unique devices that have downloaded your Practice Connect app, including registered responsible parties, registered patients, and other users.
Procedure Time (in minutes)![]() - The total number of minutes patients were "Seated" during the specified time frame. This calculation is only correct if patients sign into your system and progress through your
- The total number of minutes patients were "Seated" during the specified time frame. This calculation is only correct if patients sign into your system and progress through your
Professional Referrals![]() - The number of patients whose primary referral source is on your "Professionals" list, and who were referred within the specified time frame.You can find both the primary referral source and the associated referral date in the Patient Information Panel of the patient folder. (See "Create Professional Records" for details about maintaining your Professionals list).
- The number of patients whose primary referral source is on your "Professionals" list, and who were referred within the specified time frame.You can find both the primary referral source and the associated referral date in the Patient Information Panel of the patient folder. (See "Create Professional Records" for details about maintaining your Professionals list).
Receipts![]() - The total receipts posted for the specified period of time.
- The total receipts posted for the specified period of time.
Receipts Per Appointment![]() - The ratio of total receipts collected to the number of patients with a kept or missed appointment during the specified time frame.
- The ratio of total receipts collected to the number of patients with a kept or missed appointment during the specified time frame.
Receipts Per Doctor Hour![]() - The ratio of receipts posted to the number of doctor hours worked during the specified time frame. (See "Scheduler Templates Editor" for details about defining the number of doctor, staff, and total hours worked per day.
- The ratio of receipts posted to the number of doctor hours worked during the specified time frame. (See "Scheduler Templates Editor" for details about defining the number of doctor, staff, and total hours worked per day.
Receipts Per Staff Hour![]() - The ratio of receipts posted to the number of staff hours worked during the specified time frame. (See "Scheduler Templates Editor" for details about defining the number of doctor, staff, and total hours worked per day.)
- The ratio of receipts posted to the number of staff hours worked during the specified time frame. (See "Scheduler Templates Editor" for details about defining the number of doctor, staff, and total hours worked per day.)
Referrals![]() - The number of patients whose primary referral date is within the specified time frame, regardless of whether the referral source is a Professional, a Patient, or Other referral. You can find both the primary referral source and the associated referral date in the Patient Information Panel of the patient folder.
- The number of patients whose primary referral date is within the specified time frame, regardless of whether the referral source is a Professional, a Patient, or Other referral. You can find both the primary referral source and the associated referral date in the Patient Information Panel of the patient folder.
Scheduled Appointments![]() - The number of appointments processed as Kept or Missed during the specified time frame.
- The number of appointments processed as Kept or Missed during the specified time frame.
Scheduled Wait (in minutes)![]() - The total number of minutes past the scheduled appointment time that patients were "Seated", regardless of the time they signed into your
- The total number of minutes past the scheduled appointment time that patients were "Seated", regardless of the time they signed into your
Seated Patients![]() - The number of patients that were "Seated" during the specified time frame. This calculation is only correct if patients sign into your system and progress through your
- The number of patients that were "Seated" during the specified time frame. This calculation is only correct if patients sign into your system and progress through your
Staff Hours![]() - The number of staff hours defined in the grid templates assigned to the specified time frame. ( See "Scheduler Templates Editor" for details about defining the number of doctor, staff, and total hours worked per day.)
- The number of staff hours defined in the grid templates assigned to the specified time frame. ( See "Scheduler Templates Editor" for details about defining the number of doctor, staff, and total hours worked per day.)
Start Conversion %![]() - The percentage of the total number of kept appointments with the Types of "Exam" and "Start" that were "Start".
- The percentage of the total number of kept appointments with the Types of "Exam" and "Start" that were "Start".
Start Conversion Made %![]() - The percentage of the total number of scheduled appointments with the procedure types of "Exam" and "Start" that are "Start".
- The percentage of the total number of scheduled appointments with the procedure types of "Exam" and "Start" that are "Start".
Total A/R![]() - The total amount owed to the practice: This statistic always shows your current receivables, regardless of the time frame specified for the Practice Monitor.
- The total amount owed to the practice: This statistic always shows your current receivables, regardless of the time frame specified for the Practice Monitor.
Treatment Completions![]() - The total number of patients who completed treatment during the specified time frame. All treatment completions, whether early, on time, or past, are included. (Treatment times are calculated from the Expected Appliance Removal date and Actual Appliance Removal date. You can find these dates on the Findings page of the patient folder.)
- The total number of patients who completed treatment during the specified time frame. All treatment completions, whether early, on time, or past, are included. (Treatment times are calculated from the Expected Appliance Removal date and Actual Appliance Removal date. You can find these dates on the Findings page of the patient folder.)
When you are happy with your widget settings, click anywhere on your screen, or press Enter on your keyboard to exit the window. The settings are saved and applied to the widget immediately. All your settings are saved even if you exit and reopen the widget.
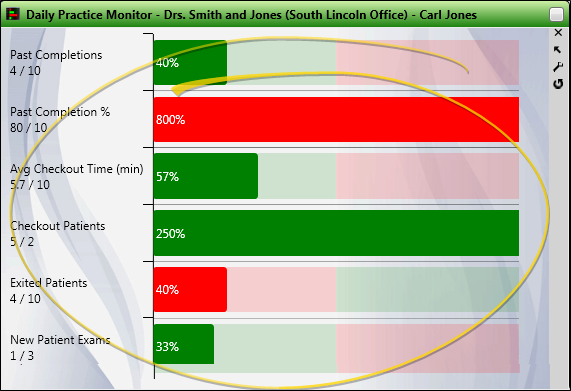
Your selected time frame, office, and orthodontist settings are listed in the Practice Monitor header for easy recognition of the data you are viewing. In addition, the current total, as well as the goals you set appear with each type of data displayed. Your progress toward each goal appears in the bar graph: Red indicates you are behind, and green indicates you are meeting or exceeding the goal.
Individual Patient Progress - The Practice Monitor tracks statistics as a whole, without displaying any patient-identifying details. You can review individual patient progress toward financial obligations and expected treatment completion from within the patient folder.
Depending on your device and panel format, you can expand and minimize widget panels, move the widget location on your screen, float them in their own windows, refresh and print data, and close the widget when you no longer need it. See Application widgets or Your Dashboard for details about using these features.